--- CV ---
SUFIAN ALAM
Data Analyst | AI Generalist | UIUX | Graphics
Iqama #: 2642964460
Contact #: 2642964460
[email protected]
Jubail, Saudi Arabia.
Professional Summary
I am a detail oriented Data Analyst with a solid background in both UX design and data visualization. I love turning
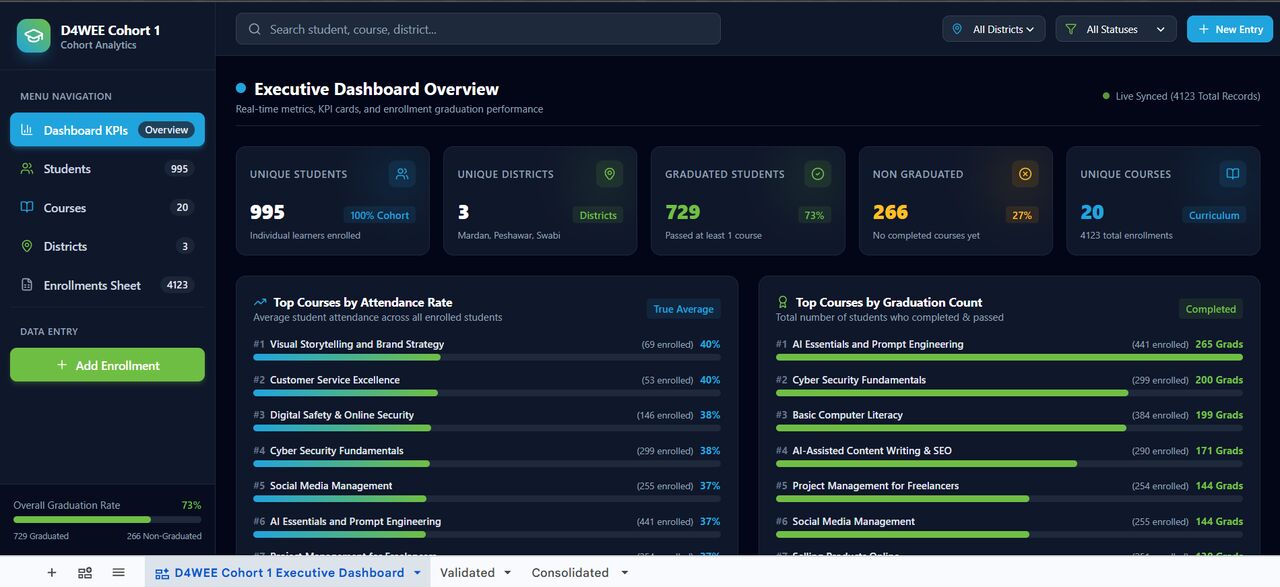
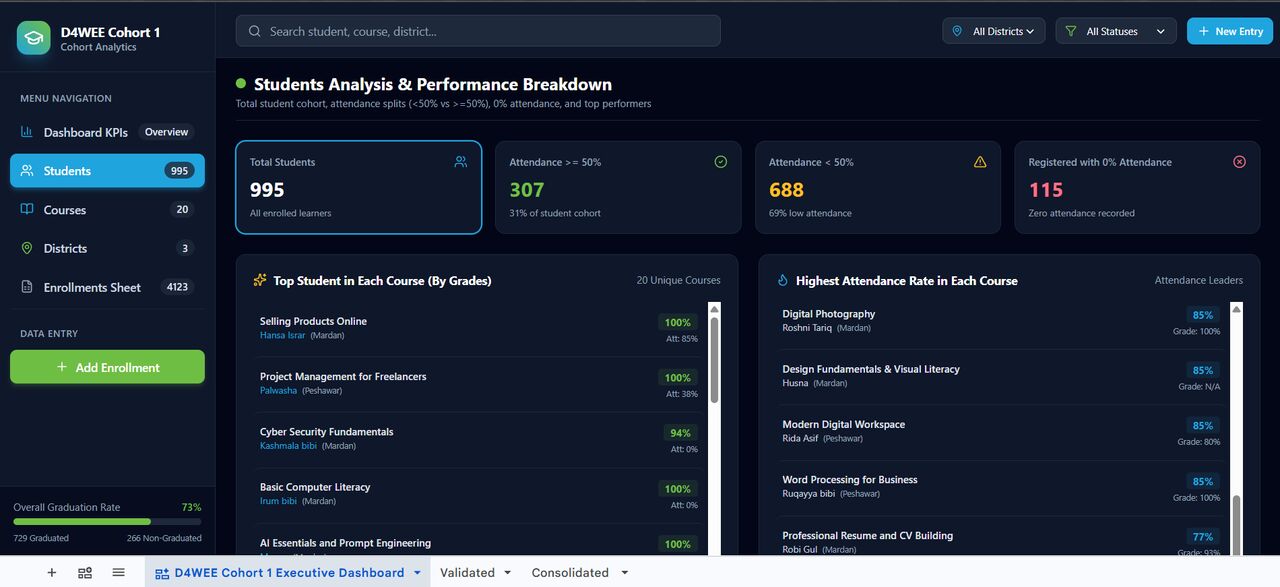
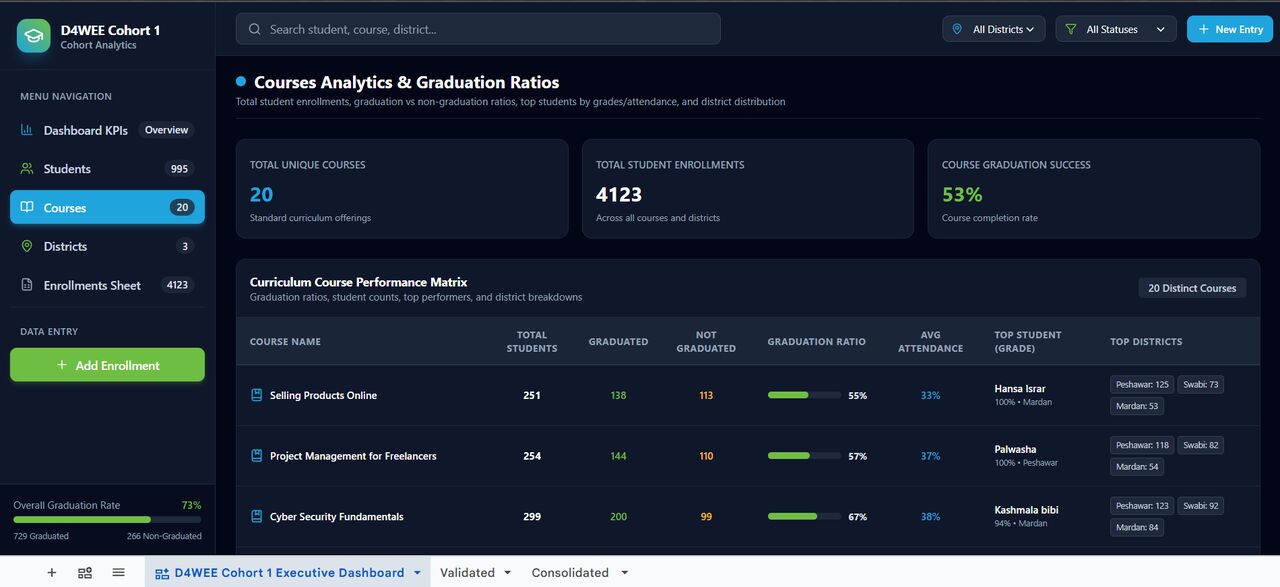
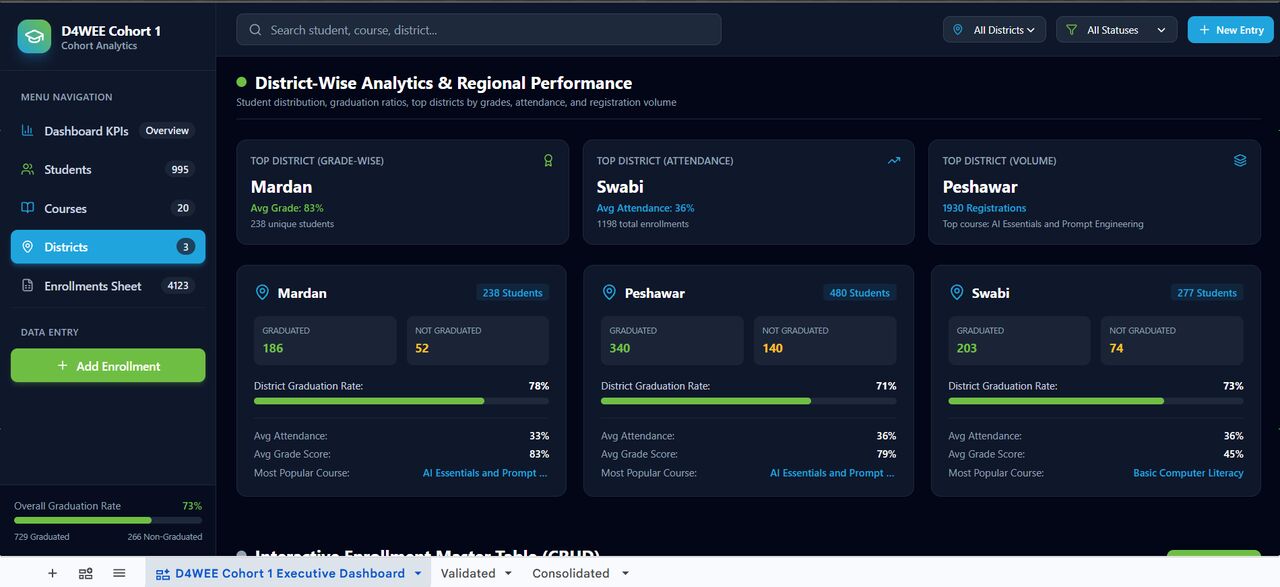
complex datasets into clear interactive dashboards that help teams make better business decisions. My work
connects technical data with strategic thinking and clear communication so stakeholders get real value from every
report. I enjoy digging deep into metrics to find patterns that might otherwise go unnoticed. Good analysis is not just
about raw numbers but about telling a clear story that anyone can understand. Because of my design roots I build
visual reports that are truly intuitive for everyday users. I collaborate closely with decision makers to ensure our data
directly supports long term company goals.
Experience
DATA ANALYST • Collect data from databases, spreadsheets, APIs, and third-party providers to
Code For Pakistan, support analytical and organizational requirements.
Peshawar, Khyber • Clean and preprocess datasets by correcting errors, addressing missing values,
Pakhtunkhwa. resolving inconsistencies, and preparing information for reliable analysis.
• Perform exploratory and descriptive analysis to understand data distributions,
Jan/2026 - Present
identify patterns, detect anomalies, and highlight meaningful trends.
• Create clear visualizations using appropriate charts, graphs, dashboards, and
reports to communicate analytical findings effectively.
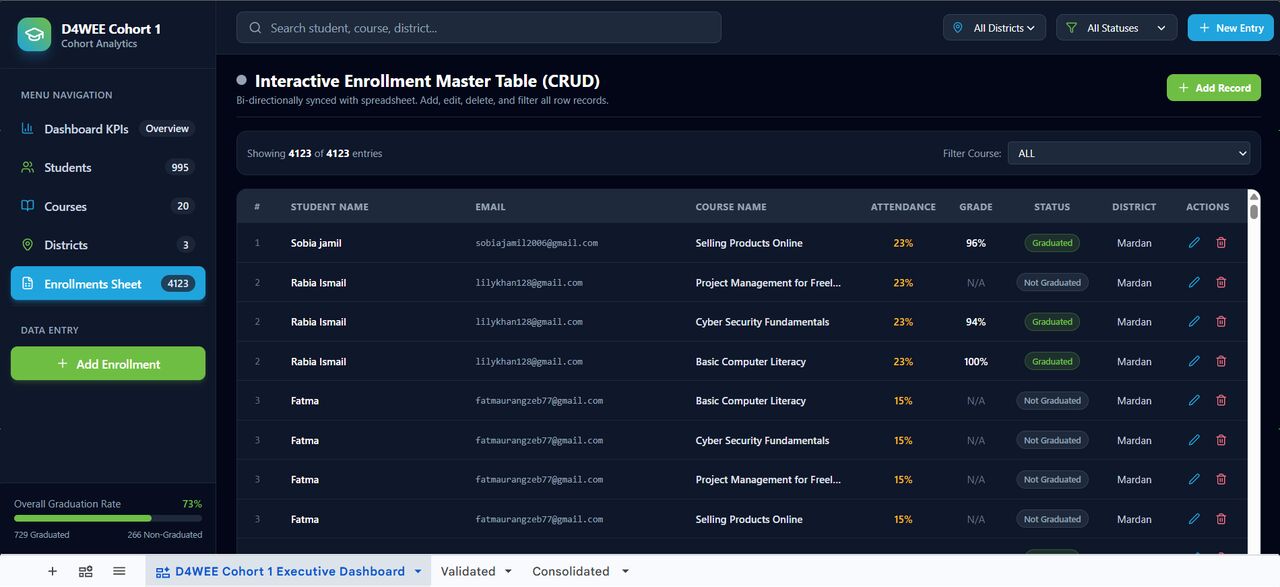
• Use Power BI to transform data into accessible dashboards and visual narratives
tailored to stakeholder and organizational needs.
• Collaborate with stakeholders, content teams, and subject-matter experts to
understand requirements and translate business questions into practical analytical
outputs.
• Maintain consistency and accuracy across datasets, reports, dashboards, and
other reporting materials.
• Manage multiple analysis and reporting assignments while meeting deadlines,
quality expectations, and organizational standards.
• Incorporate stakeholder feedback and iteratively improve reports, visualizations,
dashboards, and analytical deliverables.
• Optimize dashboards and reports for clarity, usability, performance, and
accessibility across different platforms and devices.
• Apply principles of information hierarchy, layout, and visual communication to
make analytical results easier to understand.
• Use feedback, testing, assessments, and performance metrics to evaluate
outcomes and identify opportunities for improvement.
• Develop structured reporting frameworks to monitor progress, performance, and
organizational outcomes.
• Integrate spreadsheets, Power BI, APIs, and other digital tools into data collection,
analysis, visualization, and reporting workflows.
• Ensure analytical outputs align with stakeholder requirements, organizational
objectives, and established reporting standards.
• Continuously update analytical methods, dashboards, and reporting materials to
reflect new information, emerging trends, and recognized best practices.
DATA ANALYST, GRAPHICS‫و‬ • Analyzed datasets to identify trends, patterns, and actionable insights supporting
UIUX DESIGNER informed business decisions and performance improvements.
• Created dashboards and reports using analytical tools to communicate key metrics,
Fiverr
findings, and recommendations effectively.
Peshawar, Khyber • Led design projects from conception to completion while consistently adhering to
Pakhtunkhwa. established deadlines, requirements, and budgets.
Jan/2019 - Dec/2025 • Developed targeted designs for specific clients, aligning creative solutions with
individual tastes, preferences, objectives, and expectations.
• Collaborated closely with clients to understand requirements and deliver
customized, practical, and visually effective design solutions.
• Partnered with developers to ensure optimal functionality, usability, and
implementation of all UI and UX designs.
• Designed wireframes and prototypes using Adobe Creative Suite, Sketch, Axure,
InVision, and other professional design tools.
• Developed visual design concepts and refined solutions based on stakeholder